On a clear, windy day in winter 2016 (Avignon is (in)famous for its strong northerly Mistral wind), we finally got the results of the SNP genotyping of Spanish and Italian populations of Aleppo pine, performed in collaboration with our long time partners, INIA-CIFOR in Madrid, Spain and CNR-IBBR in Florence, Italy.
Reference assembly had gone smoothly, individual samples had produced a wealth of good-quality Illumina reads. We expected clean, straightforward data analyses, as we already had good results for silver fir, European larch and Atlas cedar (this is part of the ANR-funded FLAG project).
But then, a strange signal showed up in the data. We had two groups of samples: adult trees and seedlings, and when we looked at their polymorphism patterns, they looked very different:
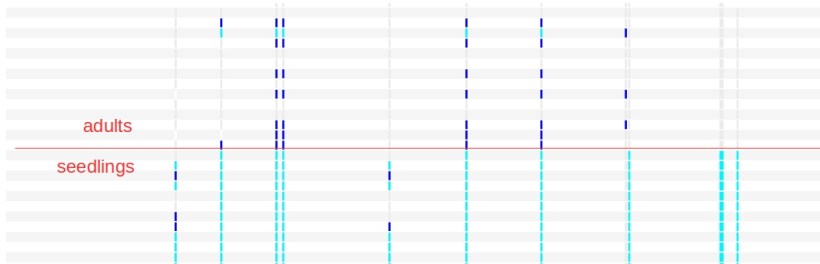
only few polymorphic sites were in common, and often the two groups were fixed for different alleles (each column in the picture is a SNP site, each colour (blue, light blue, gray) one of the three possible genotypes of a bi-allelic SNP). The whole thing just did not make any sense.
The two groups were from different plates (one full plate for adults, two half-plates for the seedlings), so with my postdoc Hadrien Lalagüe we looked for possible differences in DNA quality, sequencing batch, anything technical that would explain such a result. No pattern appeared. We were desperate for a solution for the problem, lest we accepted to toss the whole data set.
Then few weeks later we looked again at the picture. It seemed like the two groups belonged to two different, closely related species, not even to different populations.
Oh, wait a minute… did we say ‘two different species’? Perhaps, if they look like two different species, it is because they are two different species!
Can you hear that kind of ‘falsifiable hypothesis’ stuff opening its way to our brains? Popper’s spook was hovering over us.
Then we had a wider look at our data set. What other species could half of the samples belong to?
One DNA plate of maritime pine had been shipped to the sequencing lab together with the Aleppo pine plates. We held our suspect number one.
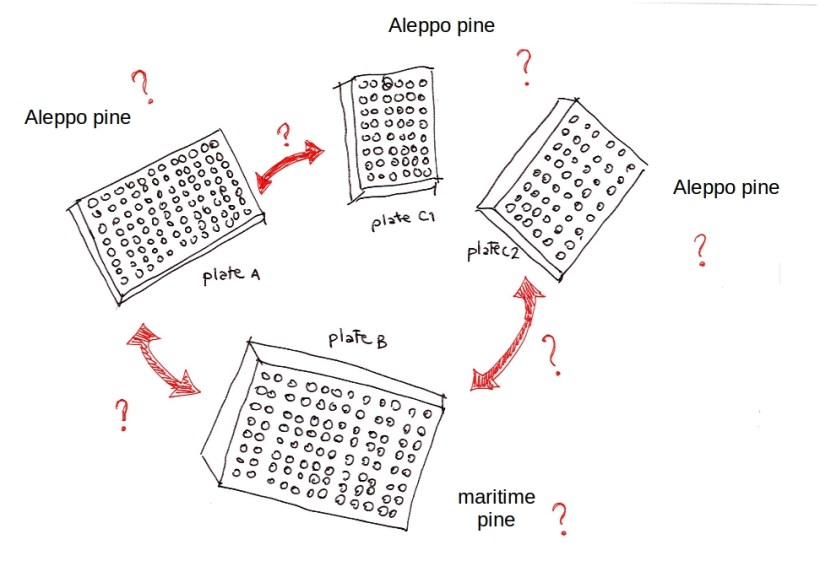
What was the most likely mistake? Nobody could possibly mistake two half plates for one full plate, right? So the only possible swap was between plate A and plate B.
What would be the expected polymorphism pattern? Because plate B was genotyped against an internal reference sequence, nothing wrong would appear in its data, no matter what the species was. On the contrary, plates A, C1 and C2 would now be a mix of two pine species – exactly the kind of mix that would produce a pattern of partially shared, partially non-overlapping polymorphisms.
The hypothesis held. Popper’s spook was smiling, but he expected us to do more: to put our hypothesis to experimental test.
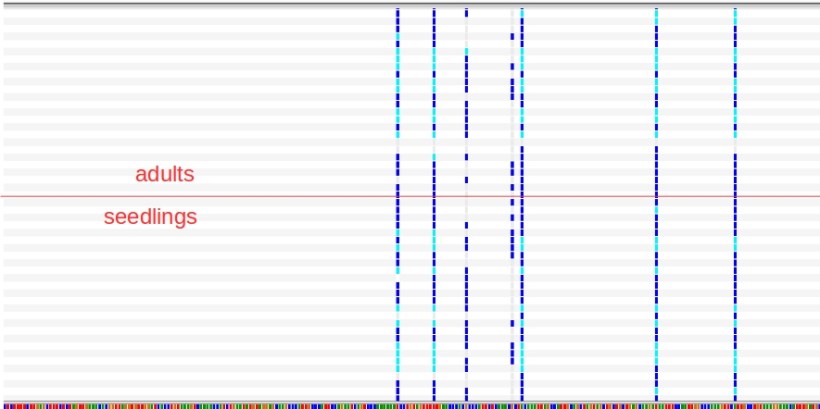
If our hypothesis was correct (plate A contained maritime pine, not Aleppo, and plate B had Aleppo, not maritime pine), then a read-mapping with plates B, C1, C2 would yield the expected nice pattern of shared SNPs.
And ta-dah! No differences in polymorphism patterns when plate A was replaced with plate B in the read-mapping (plate A, mapped against itself, was fine, of course).
We did a further check on the absolute number of polymorphisms that appeared within different groups of plates (more polymorphisms expected when mixing two different species), and showed that any group including plate A (now maritime pine) has systematically more SNPs than any group made from the remaining plates (now all Aleppo pine). So we re-ran our SNP analyses and all turned out to be fine.
Popper’s spook was now looking very happily at us.
There are few lessons to draw from this story.
First: even though we forest scientists are used to make statistical inferences, as opposed to testing hypotheses, the good old hypotetico-deductive method is still alive and kicking. It is a vital piece of our toolkit.
Second: look at your data with your eyes. The most likely hypothesis will probably pop up.
Third: never throw out an apparently bad data set too quickly. Maybe it is just begging you to look at it again, and from a different angle.
